
Civic Tech: Hack for LA
Data-Driven Advocacy for Food Access
Project Information
Role: Lead Business Analyst
Skills: Data storytelling, stakeholder strategy, Figma prototyping, cross-functional collaboration, Civic Tech.
Duration: Ongoing (2024- Present)
Website: https://la.foodoasis.net
Challenge / Context
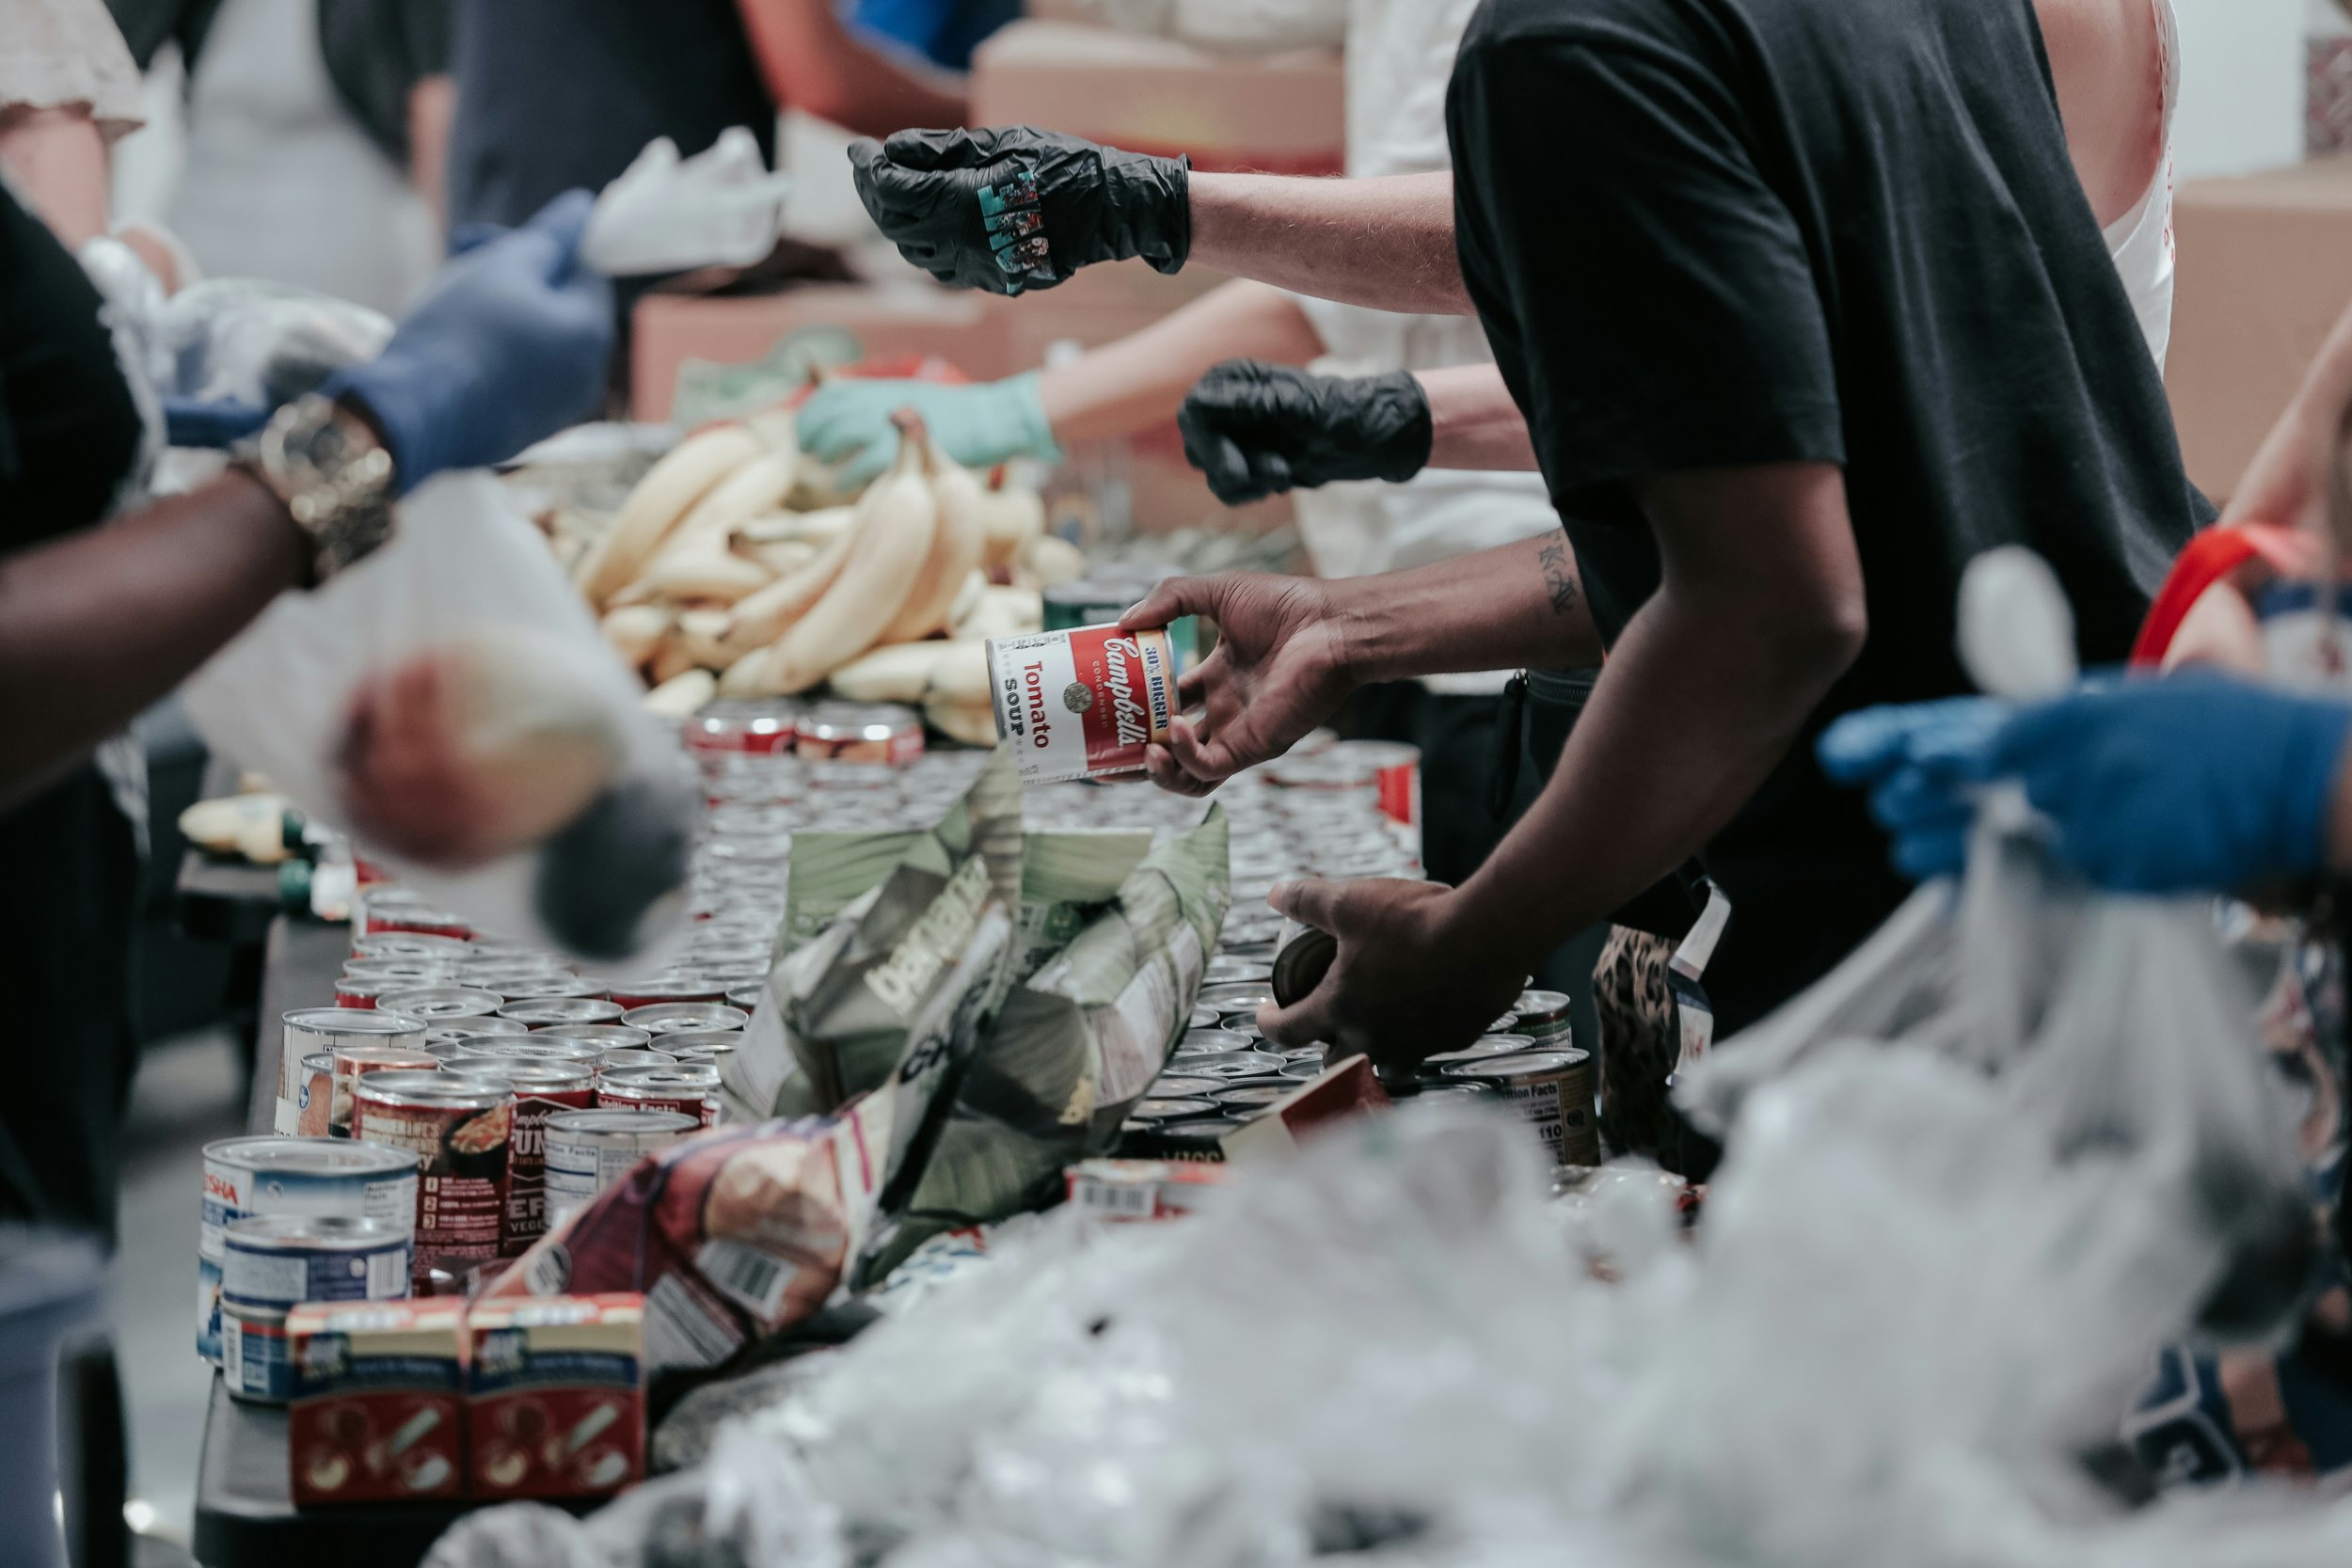
Many Los Angeles Neighborhood Councils (NCs) don’t maintain up-to-date food resource pages, leaving constituents without easy access to help. Food Oasis LA (FOLA) offers a searchable platform of free and low-cost food options. We needed a way to show NCs the value of integrating FOLA into their existing systems.
Insight / Research
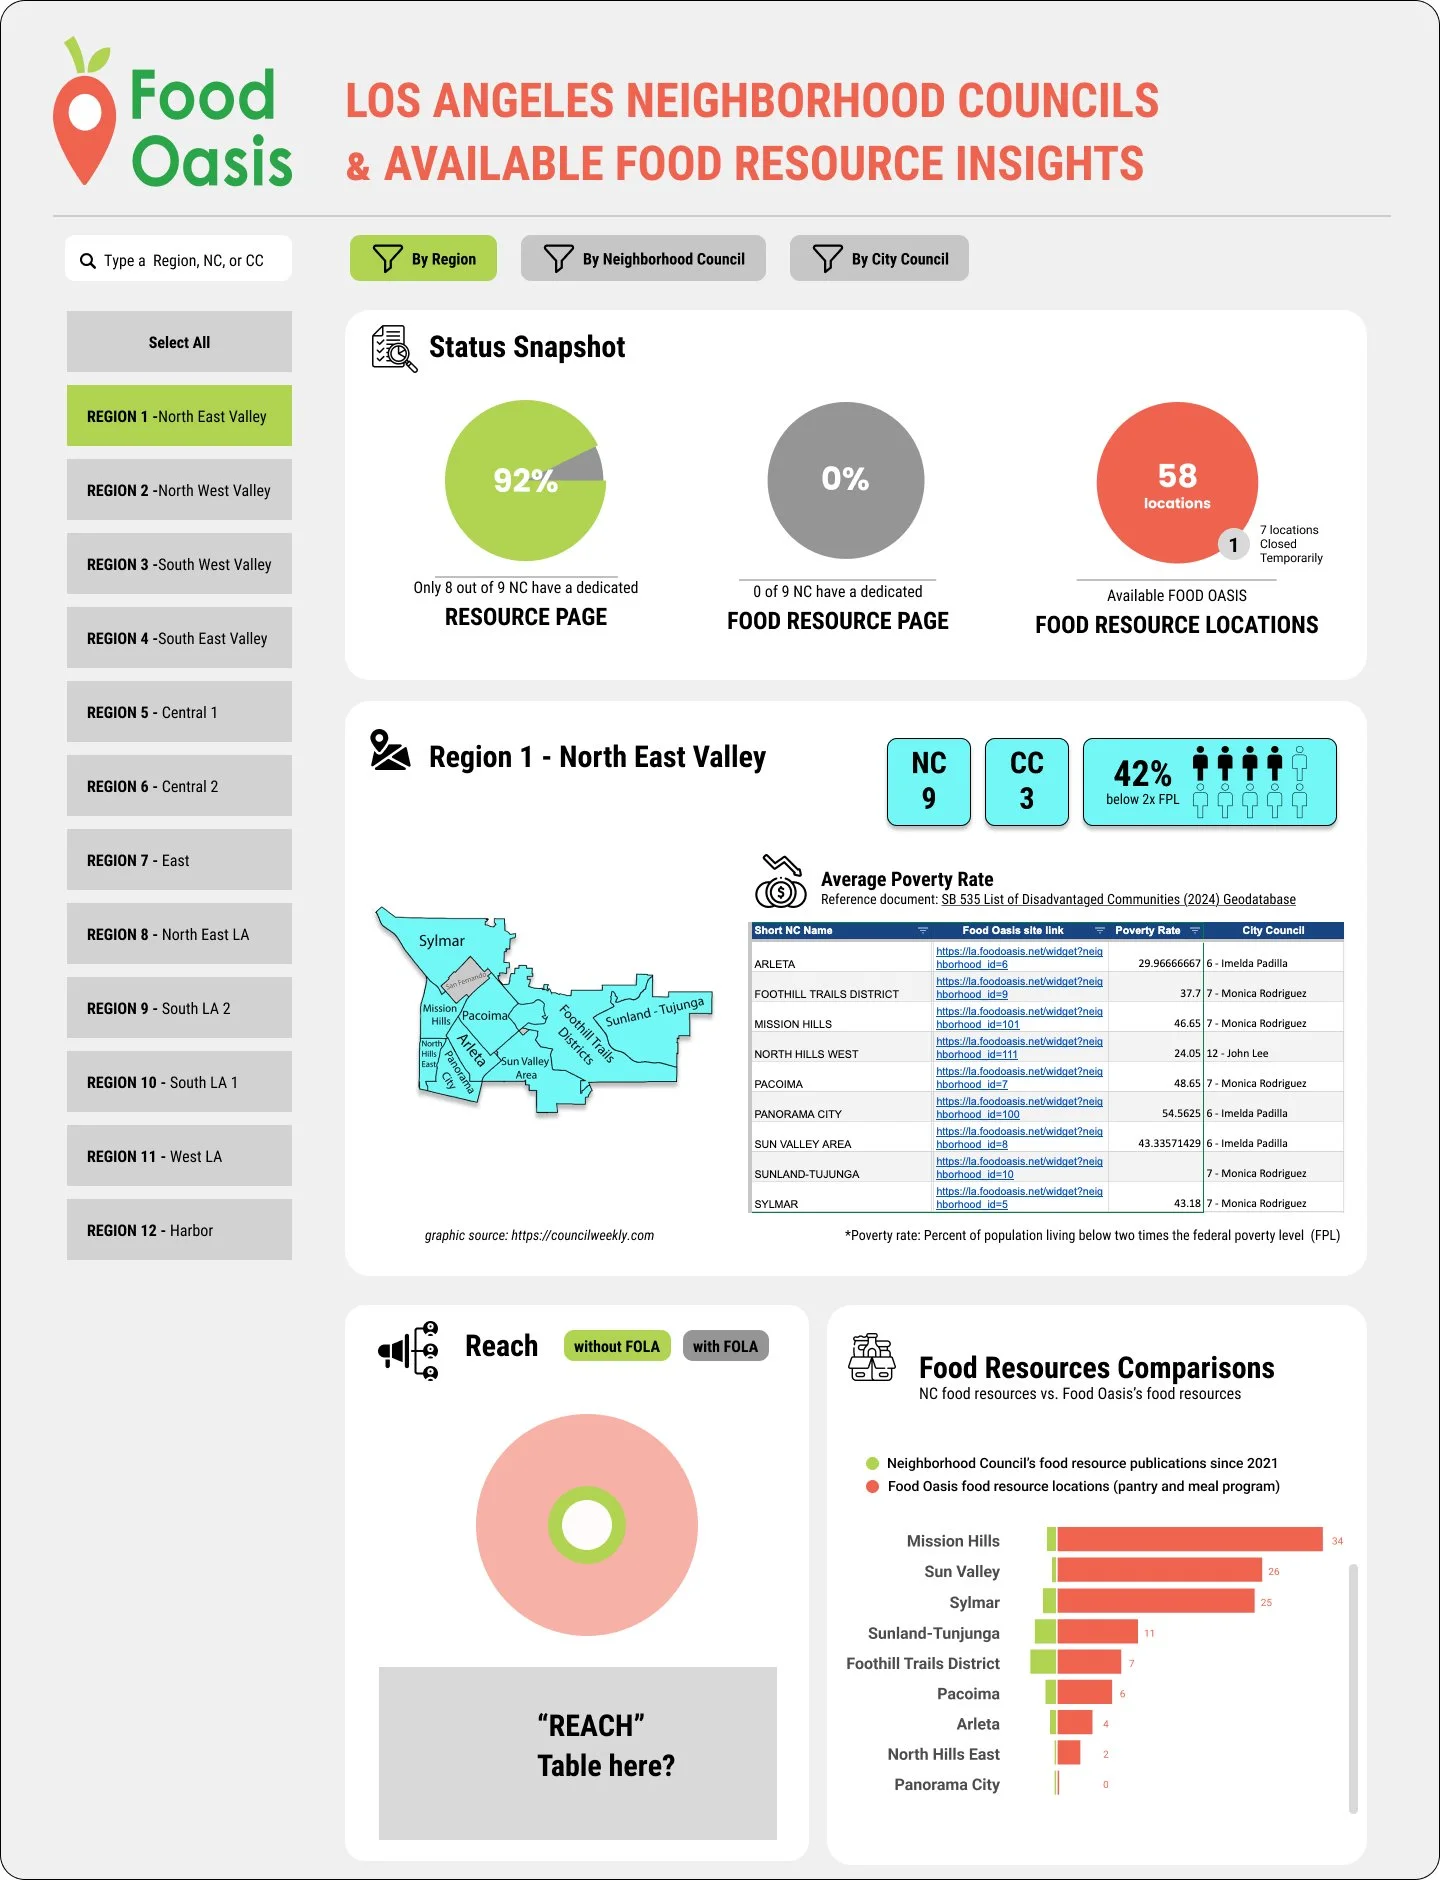
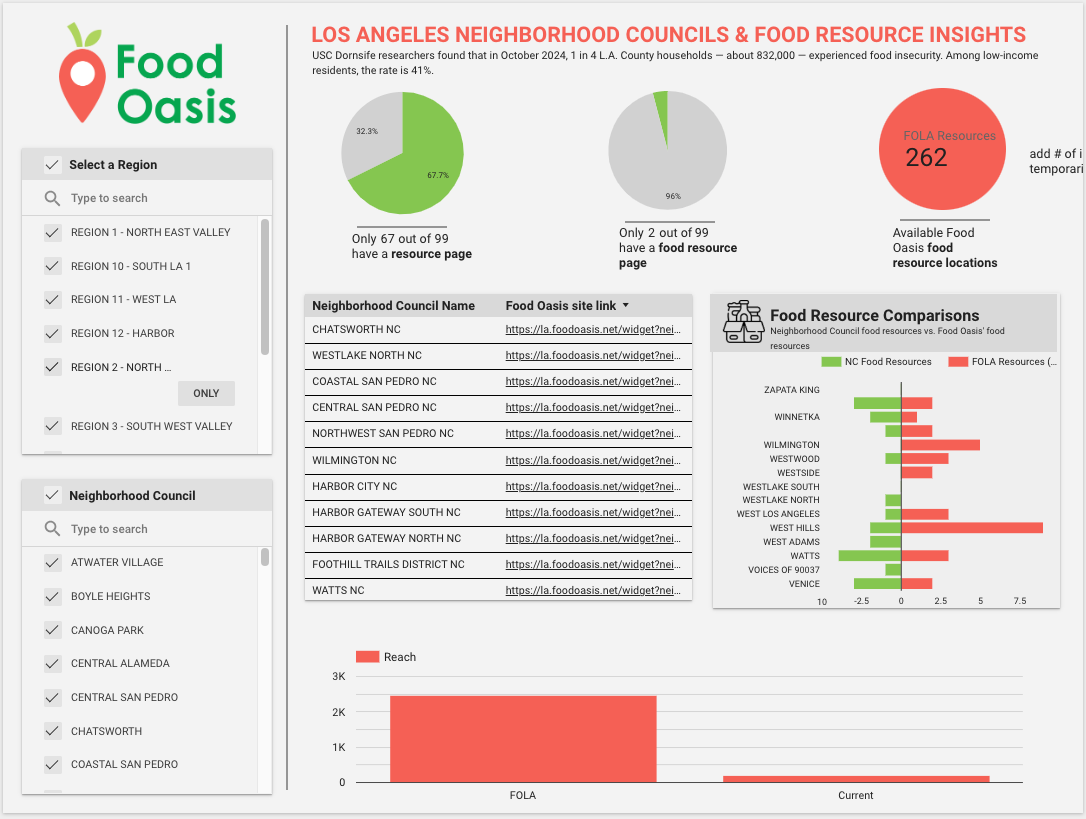
We gathered public data from over 90 NC websites to understand what food-related resources were available—or missing. We compared that data with FOLA’s existing listings to uncover gaps, trends, and opportunities for outreach.
image source: empowerla.org
Approach / Process
I. Figma Wireframes
To align the team and clarify our communication goals, I created mid to high-fidelity wireframes in Figma. These visuals mapped out how the dashboard should flow, what key messages needed to be highlighted, and how we could make complex civic data accessible to non-technical users. These mockups became essential tools for guiding dashboard development and stakeholder presentations.
II. Team Collaboration
As Business Analyst and team lead, I managed a rotating team of volunteer data scientists, many new to the tool (Google Looker) and working limited hours per week. I provided onboarding support, set sprint goals, and kept everyone aligned with our broader mission. Volunteer burnout and turnover were real challenges; I focused on fostering momentum and motivation through clear communication, weekly check-ins, and visible progress milestones.

III. Prototype / Solution
Working closely with our data team, we translated our research into a responsive, filterable dashboard built in Looker. The design emphasized clarity: users can quickly see how each Neighborhood Council compares in terms of food access content and where gaps exist. Features like summary statistics helped surface insights fast, creating a tool useful for presentations, outreach, and strategic planning.
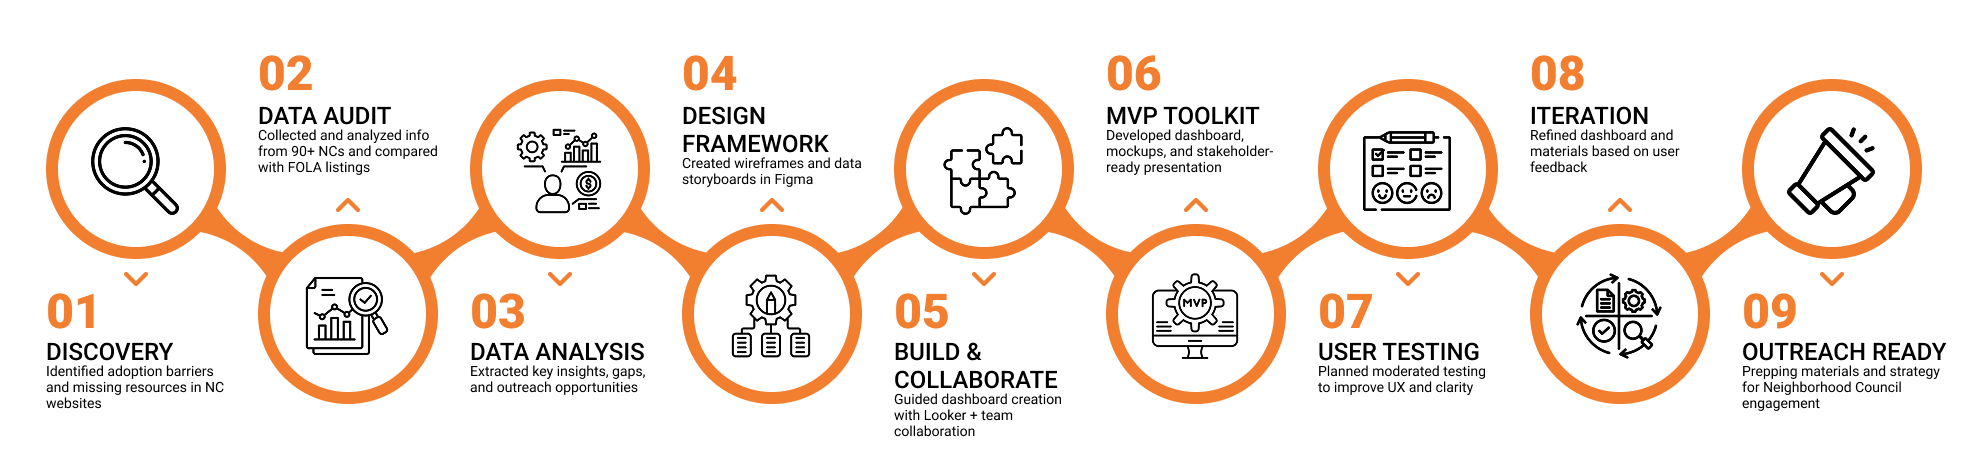
Idea-to-Impact Milestones
Impact / What’s Next
While the dashboard is still in development, we’ve reached a critical milestone: a Minimum Viable Product (MVP) paired with a compelling presentation deck that makes the data story clear, human, and actionable. I created the storytelling materials to help Neighborhood Council members quickly grasp the food access gaps in their communities and see the value of embedding FOLA.
The next step: a round of moderated user testing with internal Hack for LA stakeholders. These sessions will help us identify usability gaps, validate whether our story is landing effectively, and guide refinements before presenting the dashboard to Neighborhood Councils across Los Angeles.
We're laying the groundwork not just for a single tool, but for a repeatable model of using civic data to advocate for equitable digital resources.