
Data Visualization
Project Information
Client: PCS Inc.
Role: Lead Product Designer & Data Story Teller
Skills: Project Management, Story Telling and Data Visualization, User Research and Interviews, Information Architecture, Wire-Frame.
Tools: Figma, Adobe Photoshop, Adobe Illustrator, Miro, Microsoft Powerpoint, Power BI, Zoom.
Duration: November 2023- April 2024
The Challenge
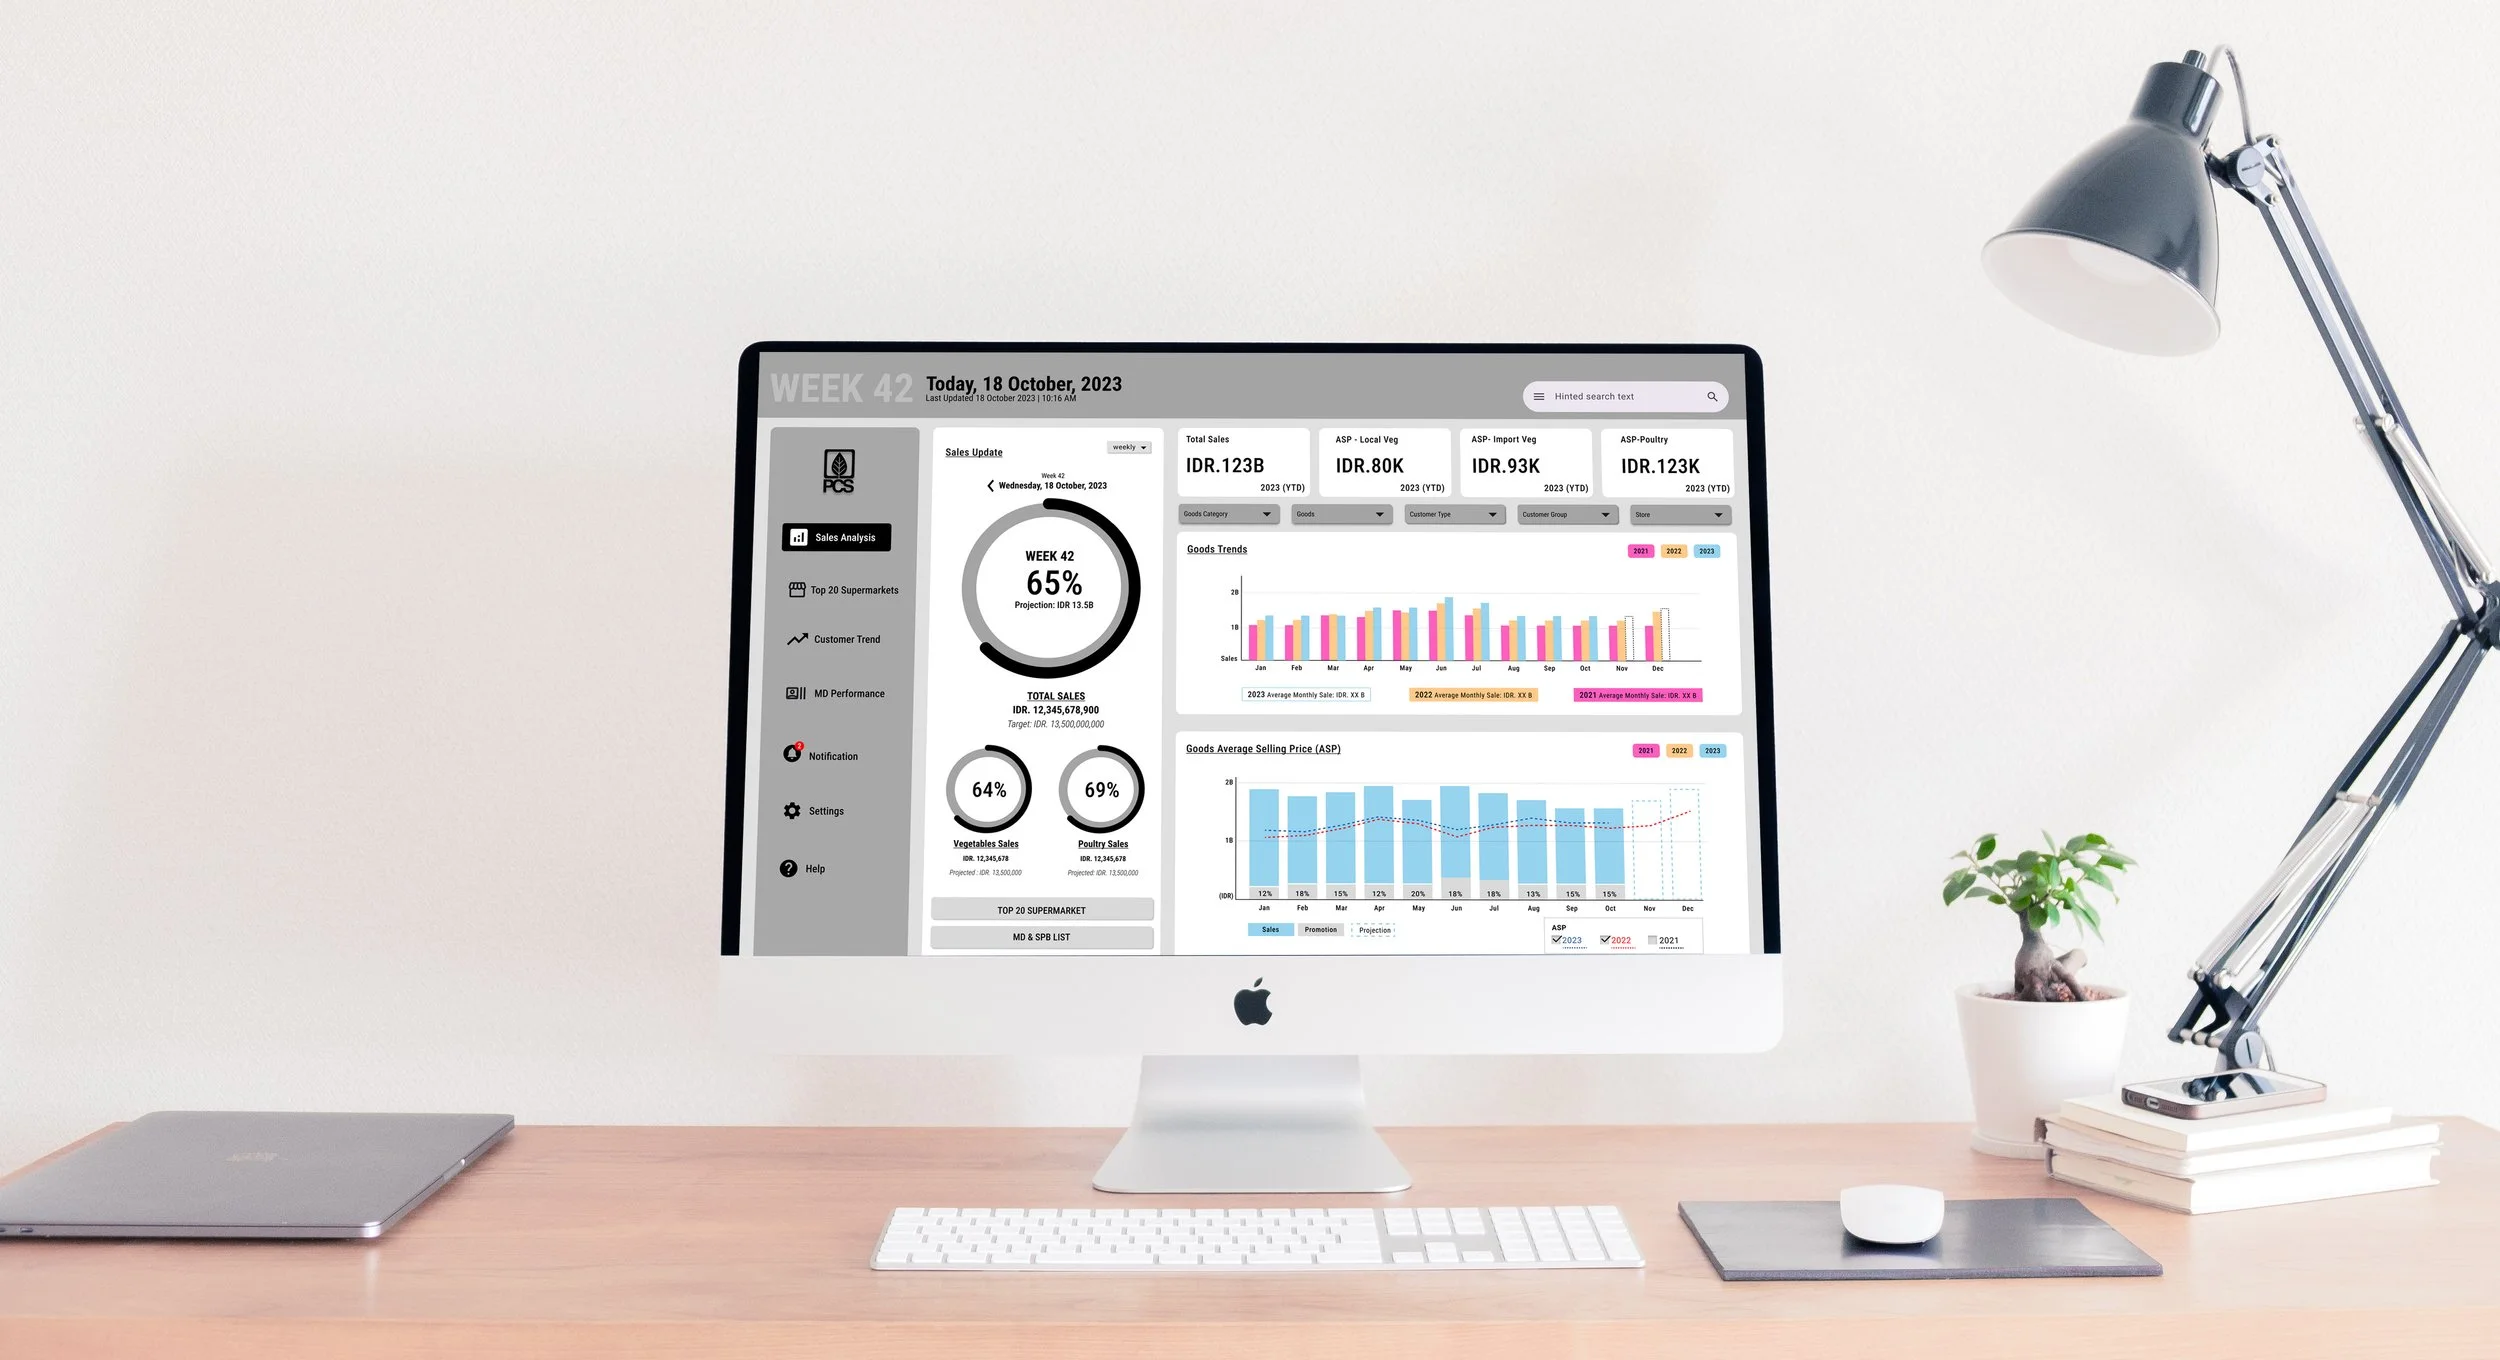
The client utilizes Microsoft Power BI but is dissatisfied with the existing layout, seeking a reorganization of the current dashboard to enhance data visualization.
Presently, the company's dashboard presents information without a clear data hierarchy. This underutilization prevents the dashboard from realizing its full potential.

“It’s not great but I got used to it” -Susan, CFO
”More often than not, I miss potential problems or opportunities that I could have been able to address sooner” -Sally, CEO
The Insights
The client asks for full access for all approved persons like the Sally (CEO), Susan (CFO), and Derrick (COO) (image source: unsplash.com). Even though their work styles are different but all value the importance of clear data visualization. With clear baseline understanding of the data, they can discuss matters and make decisions more effectively as a unified team.


Sally, Derrick, and Susan have the same motivation: to lead the company effectively based on reliable and clear data analysis.
-
Responsibilities: Review and analyze data to make effective strategic decisions for the company’s future.
Pain points: She uses the dashboard almost every day, so she is familiar with the current layout and features. However, there were many occasions when she had to call her general manager to gain clarity on some data and how it is represented on the dashboard.
-
Responsibilities: Review and analyze data and lead the finance team to forecast the company’s financial standing based on financial and operations data.
Pain points: She only uses the left half of the current dashboard. The right half does not provide clear and useful information to help her at her job
-
Responsibilities: Review and analyze data and lead the productions and operations team to manage logistics, resources, and human resources.
Pain points: The current dashboard has too much unnecessary data for his analysis. For his own sanity, he does not use the available Power BI dashboard. Instead, he has separate group of files he shares with his team to analyze the data he needs to fulfill his responsibilities.
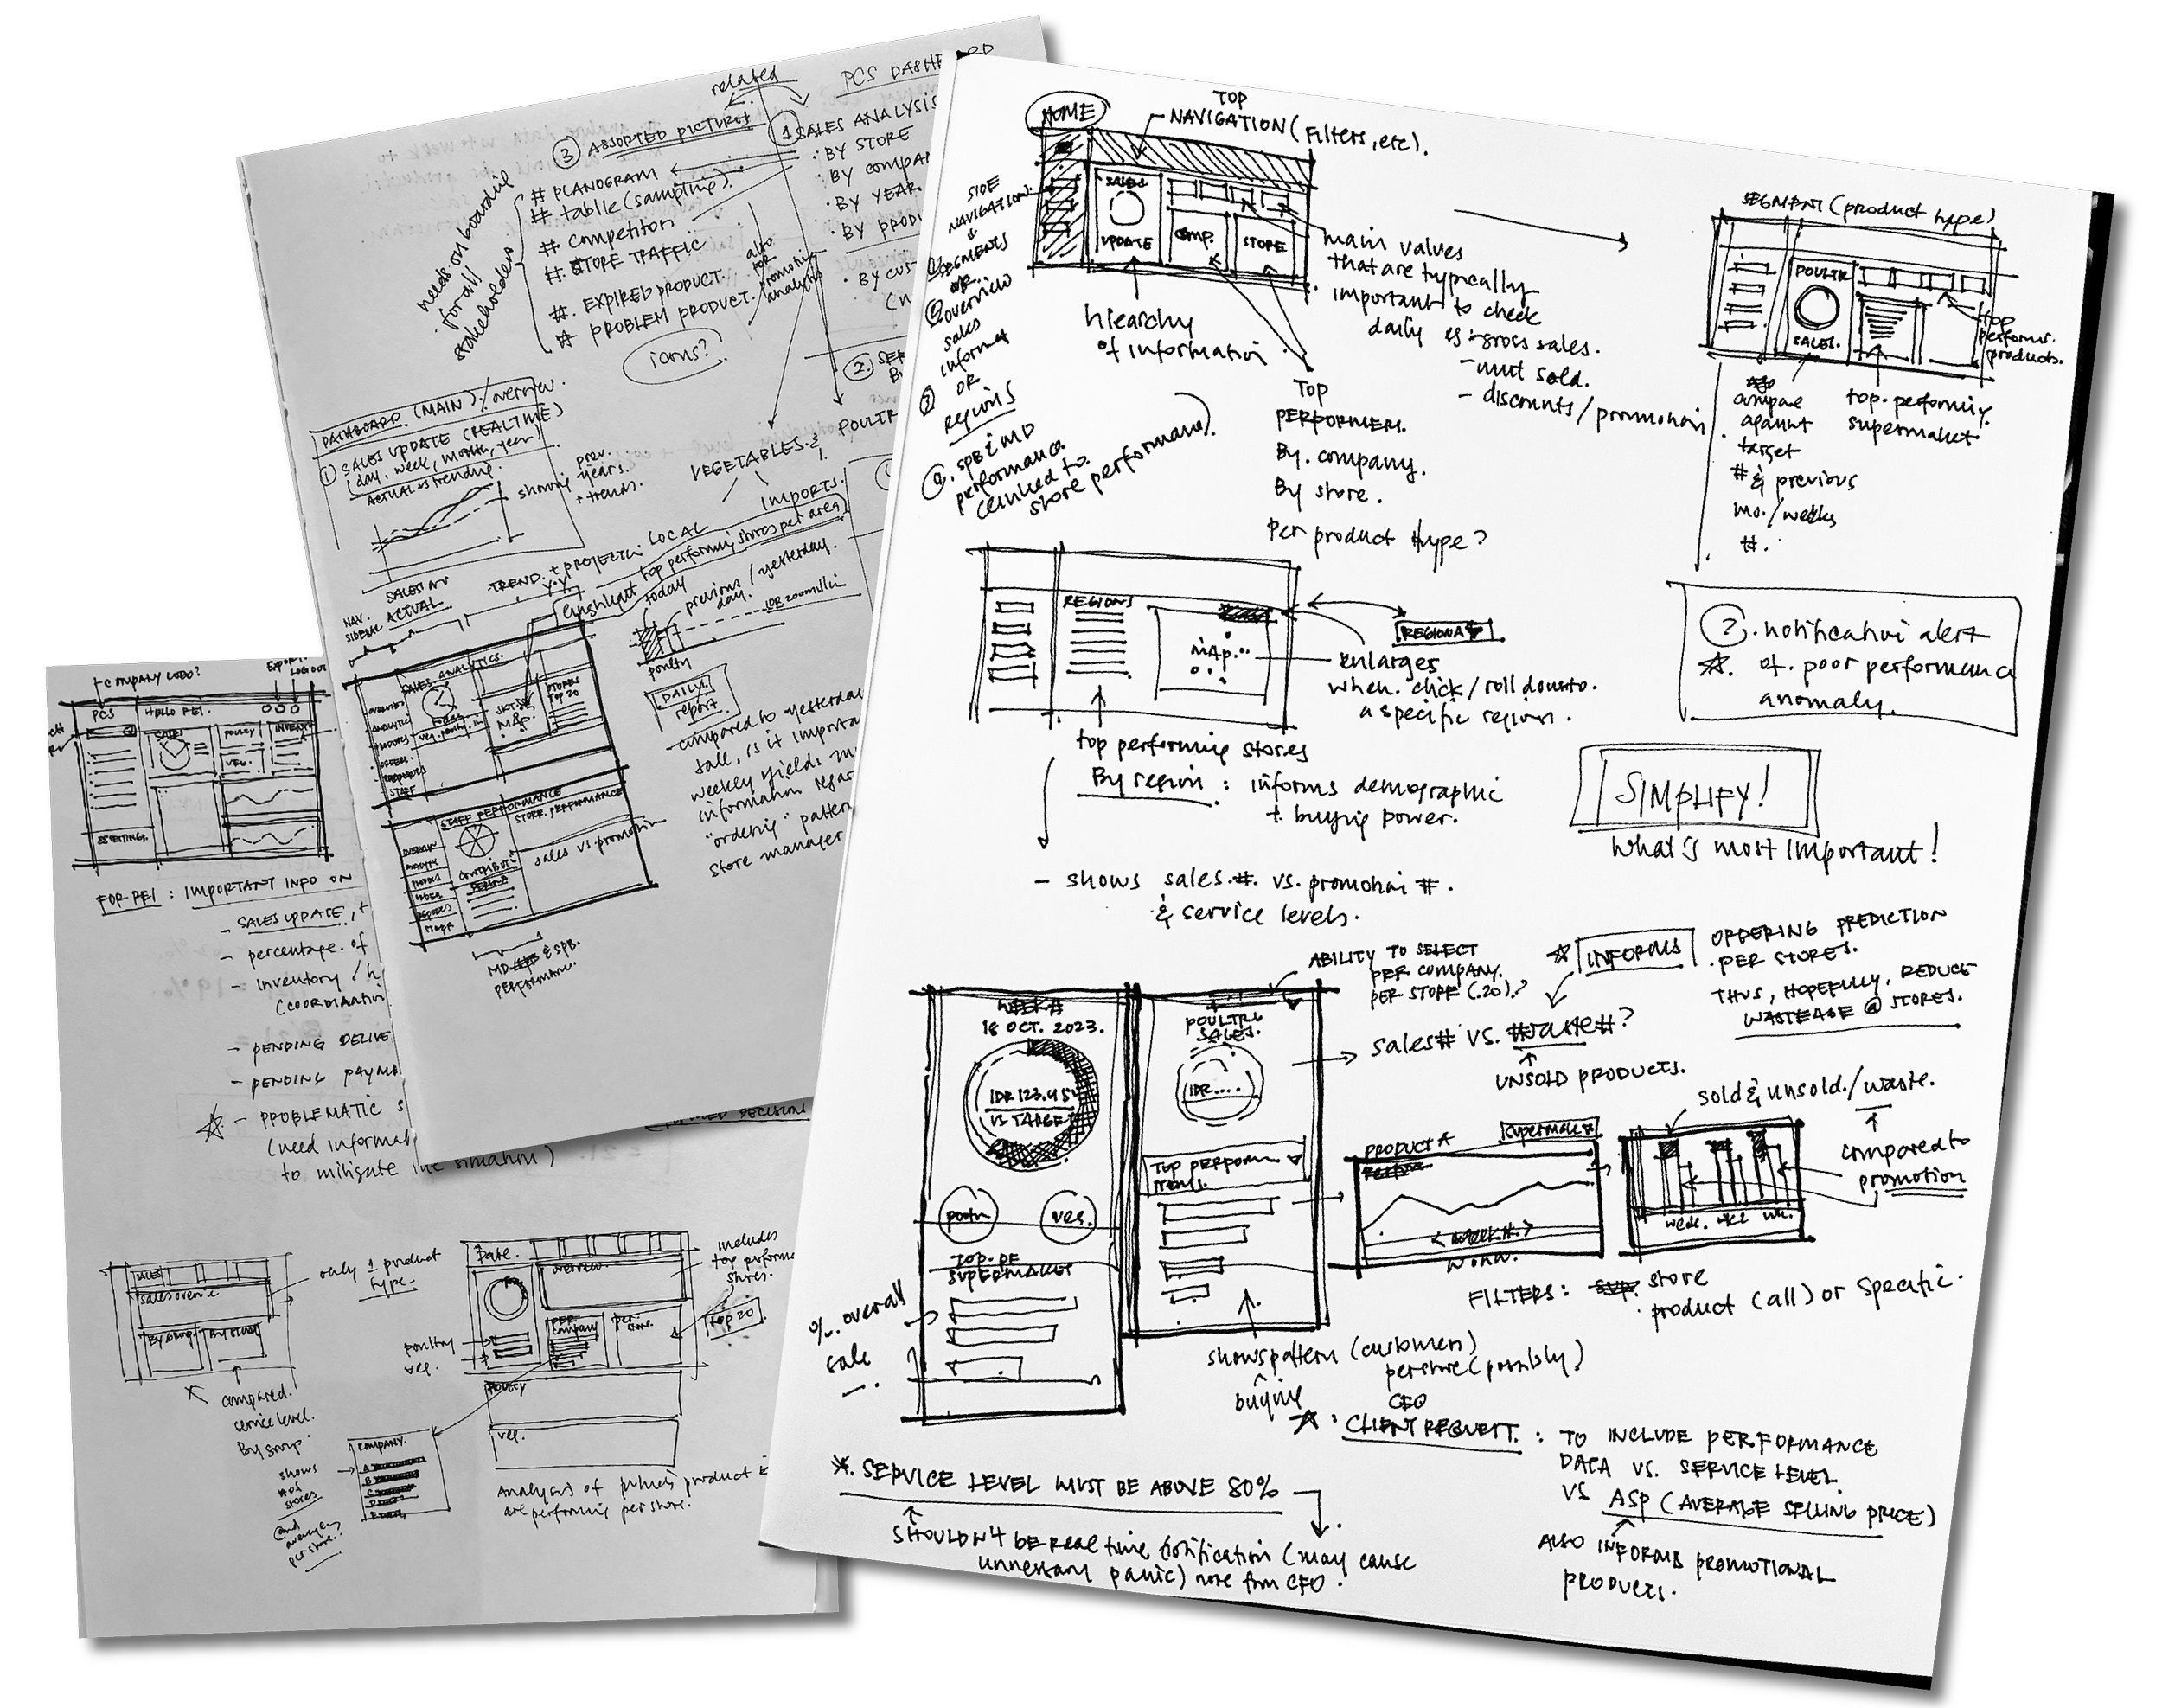
User Interviews & Impromptu Wire-framing
During the initial interviews with the CEO and CFO, I gained insights on their needs and pains as they show me how they go through the dashboard to find the information they need.
The Approach
What data is most important?
We discussed data hierarchy and what datas are important for them to make informed and effective decision for the company.
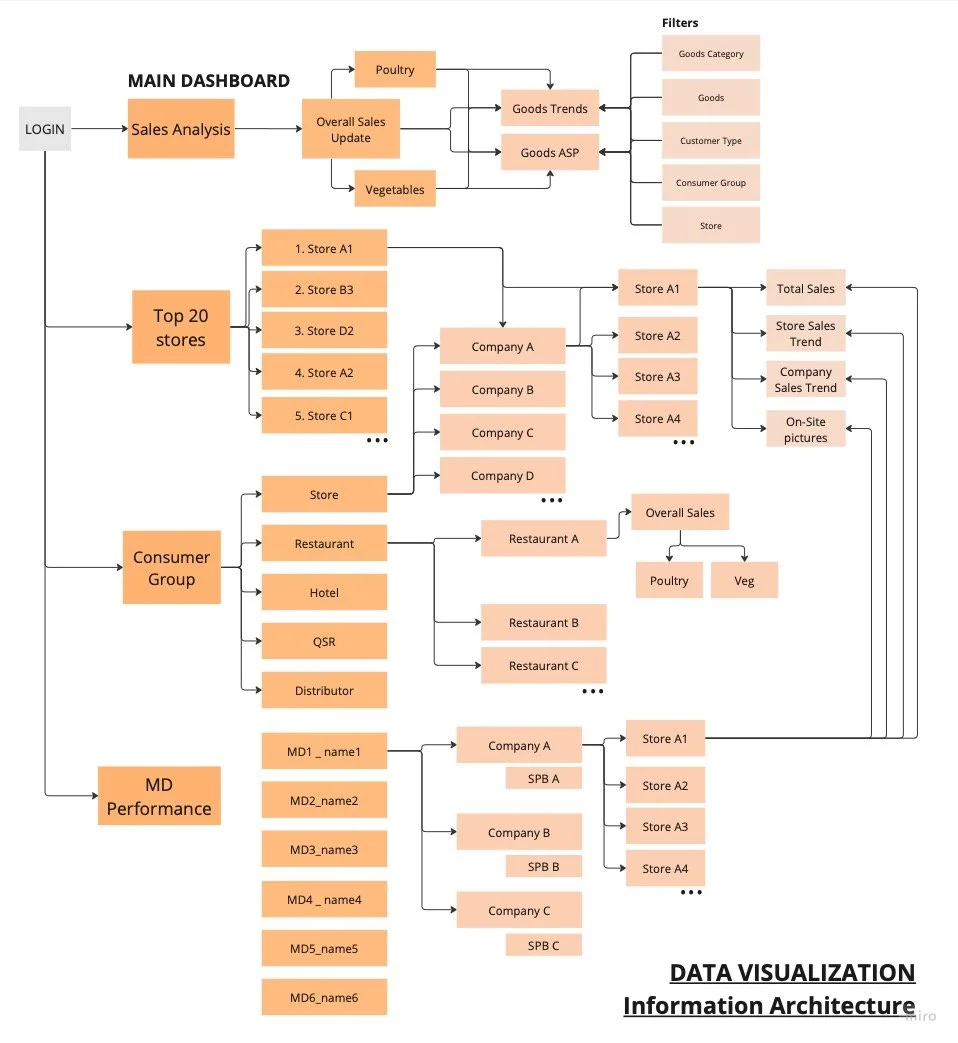
Information Architecture
This information architecture illustrates the extensive interconnection among tabs (sales analysis, top 20 stores, consumer groups, and MD performance). I structured the tabs based on prevalent discussion topics and the specific lines of inquiry addressed in the company’s weekly sales meetings.
Effective data storytelling makes it easy to comprehend large amount of data quickly, to identify patterns, to pinpoint emerging trends, and to clearly communicate data-driven business strategies.
Mid-Fidelity Prototype
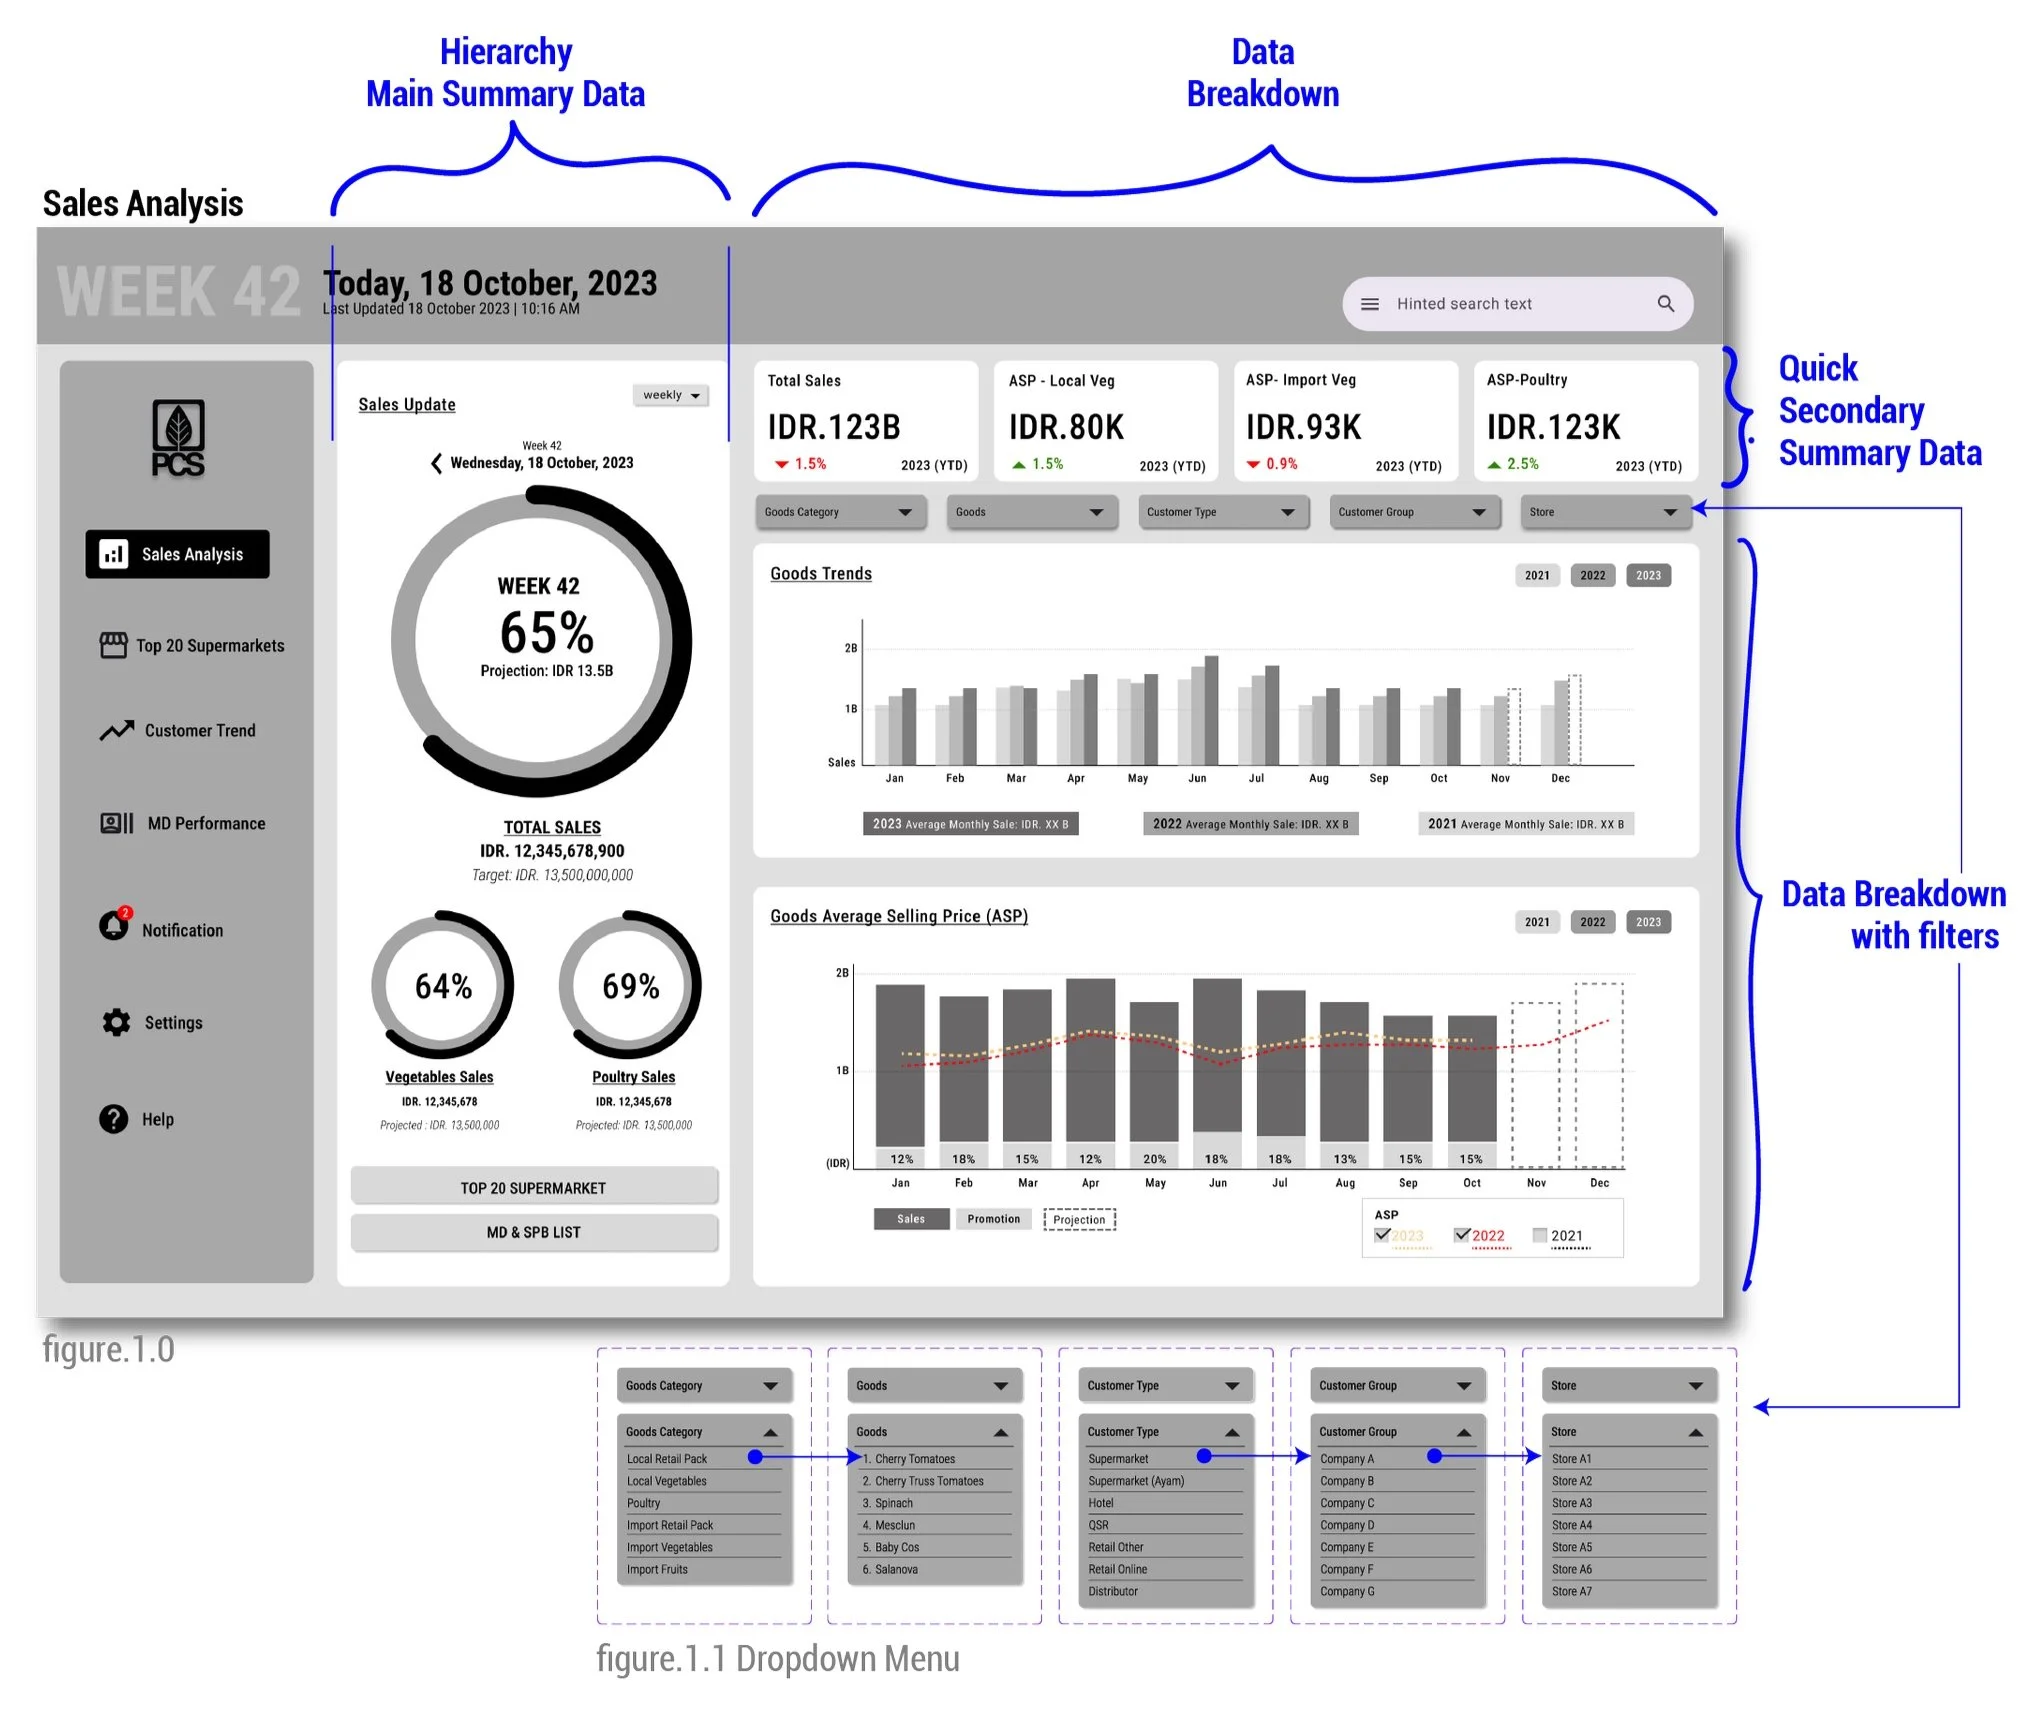
Sales Analysis page (fig1.0)
The pages will be split into three main columns. The first column is the side navigation for Sally to be able to easily select the data she seeks at the moment. The second column is the main summary data and the third column is for data breakdown that supports the main summary data on the first column. This way the eyes can focus certain sections at a time to not only reduce cognitive load, but to also help understand the data quickly.
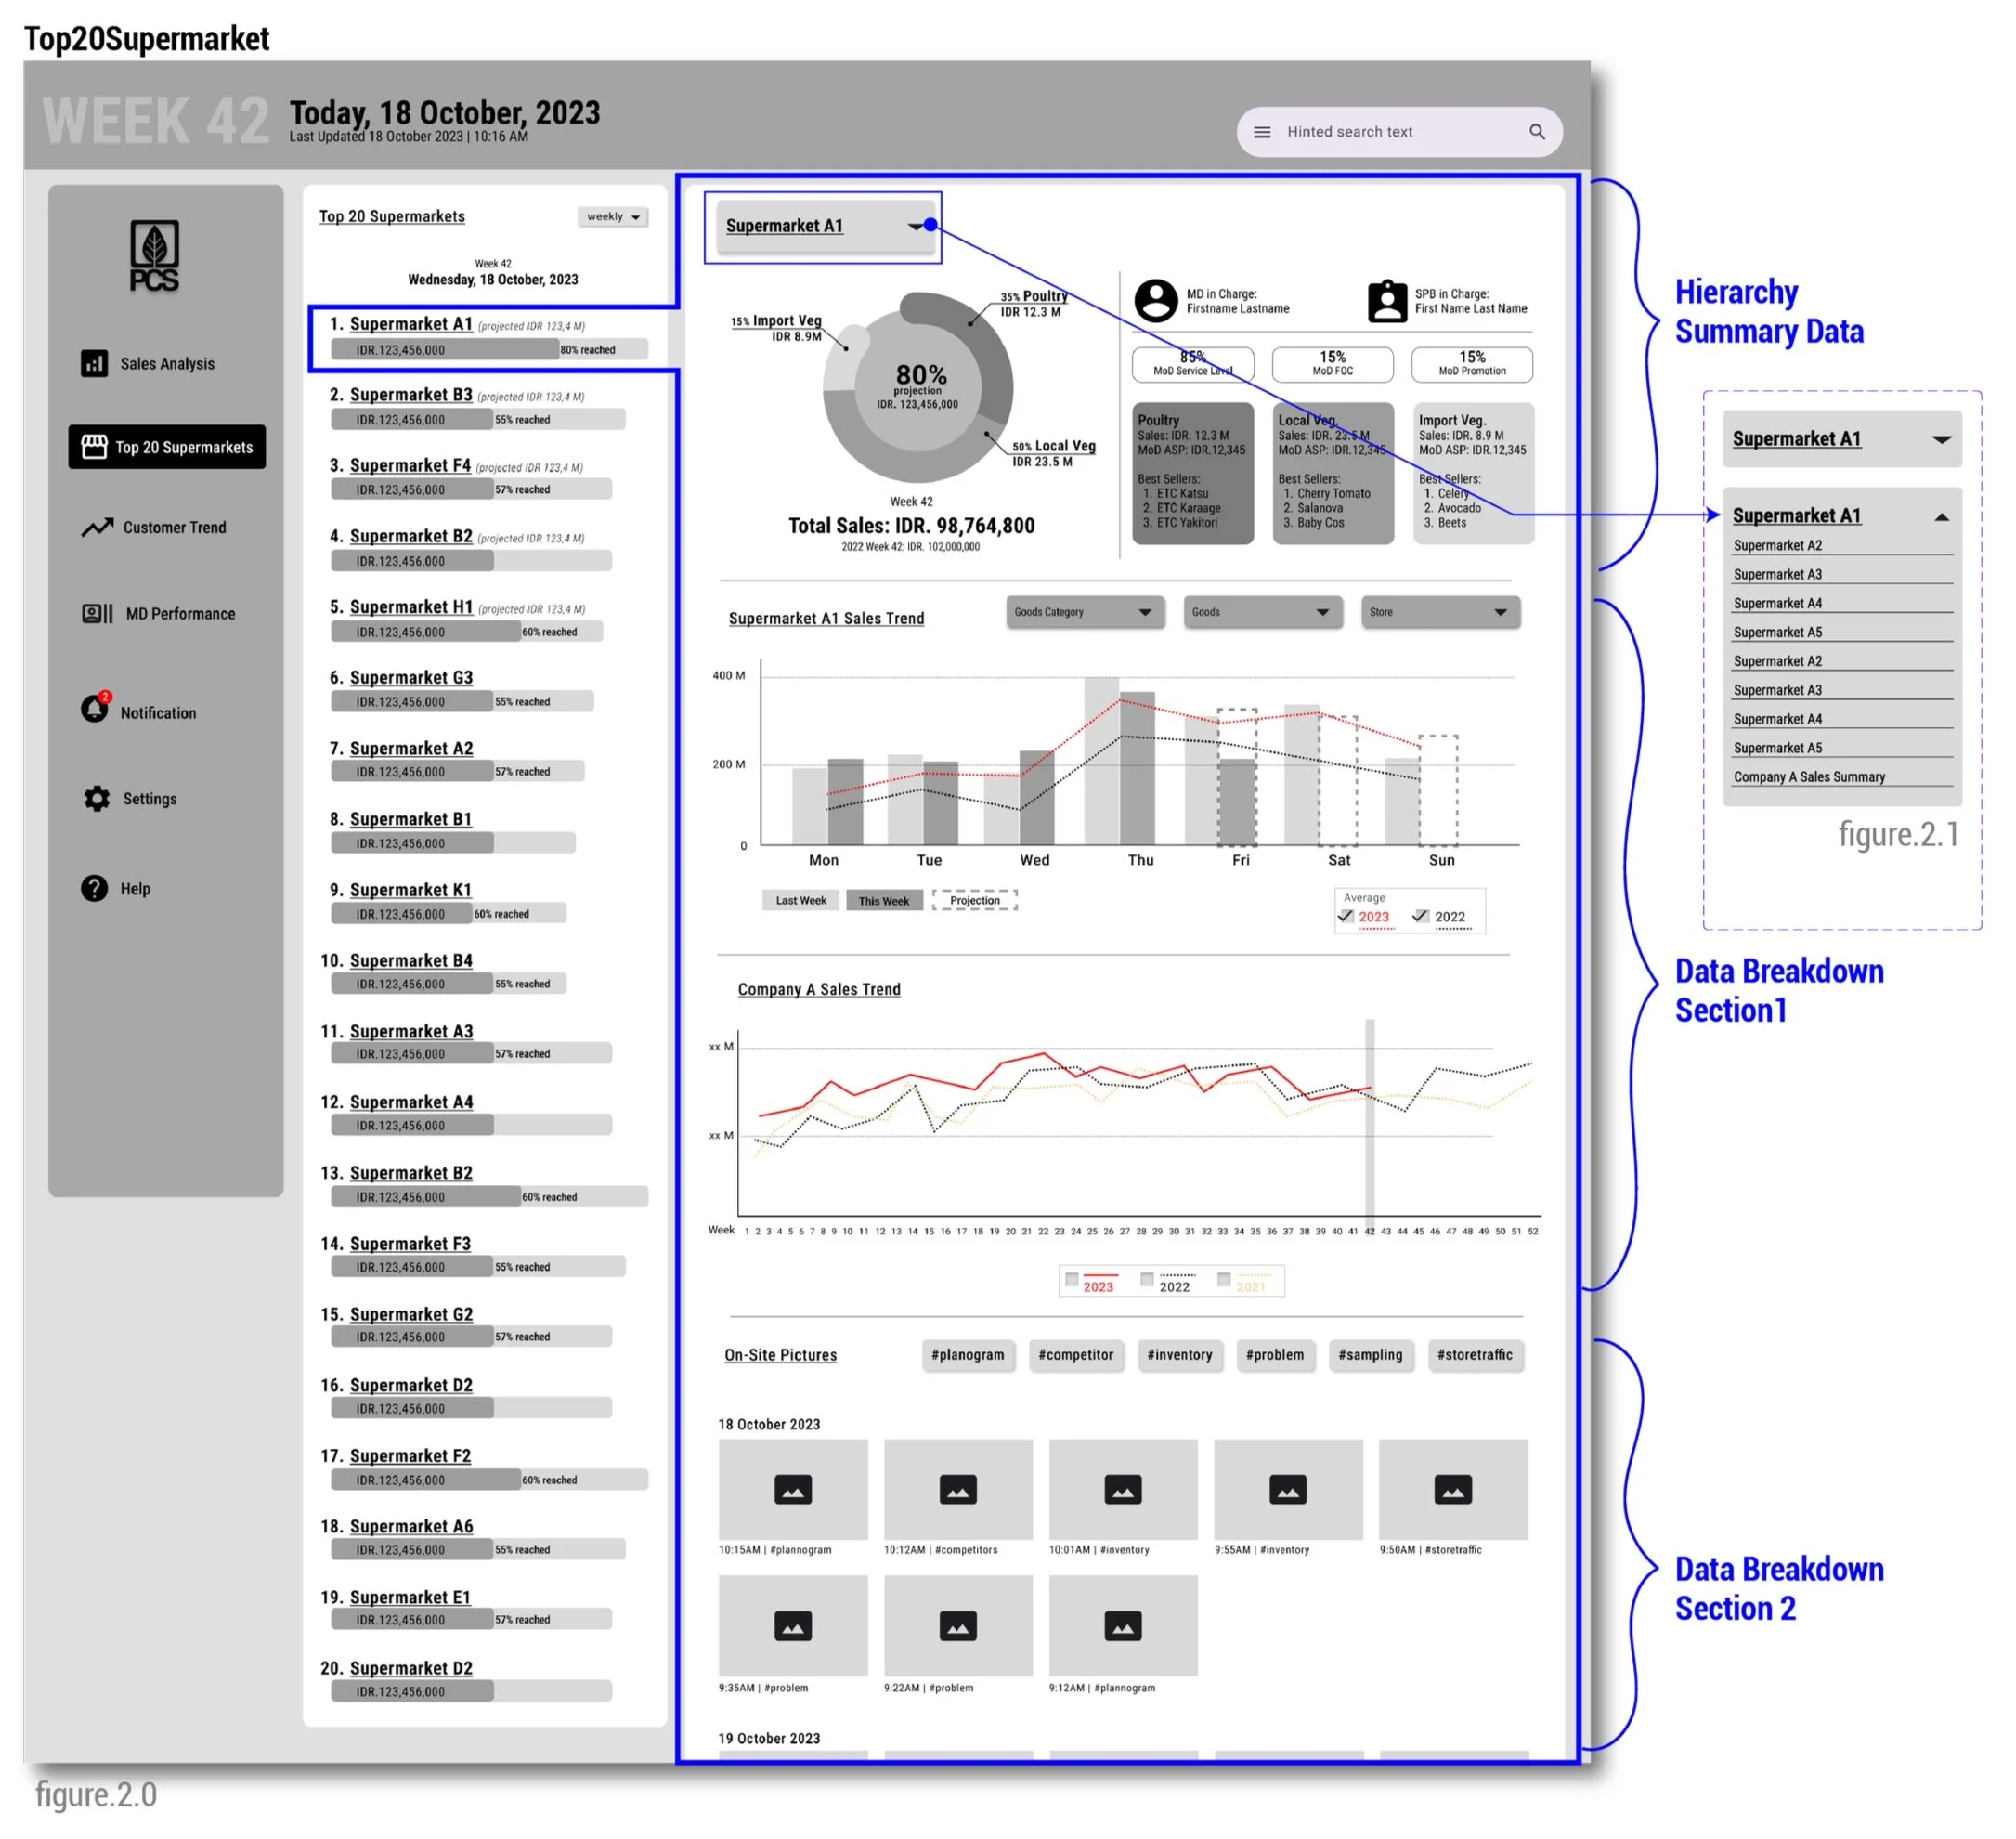
Top 20 Supermarket page (fig 2.0)
This page is specifically requested by the client because these top 20 supermarkets generate up to 50% of total supermarket sales.
In this page, the main goal is to be able to see Supermarket A1’s performance, trends, and daily reports by MD and SPB in the form of on-site pictures (see Data Breakdown Section 2).
For easy navigation, Sally will also be able to use the dropdown menu to select another supermarket by the same company: A2, A3, etc..
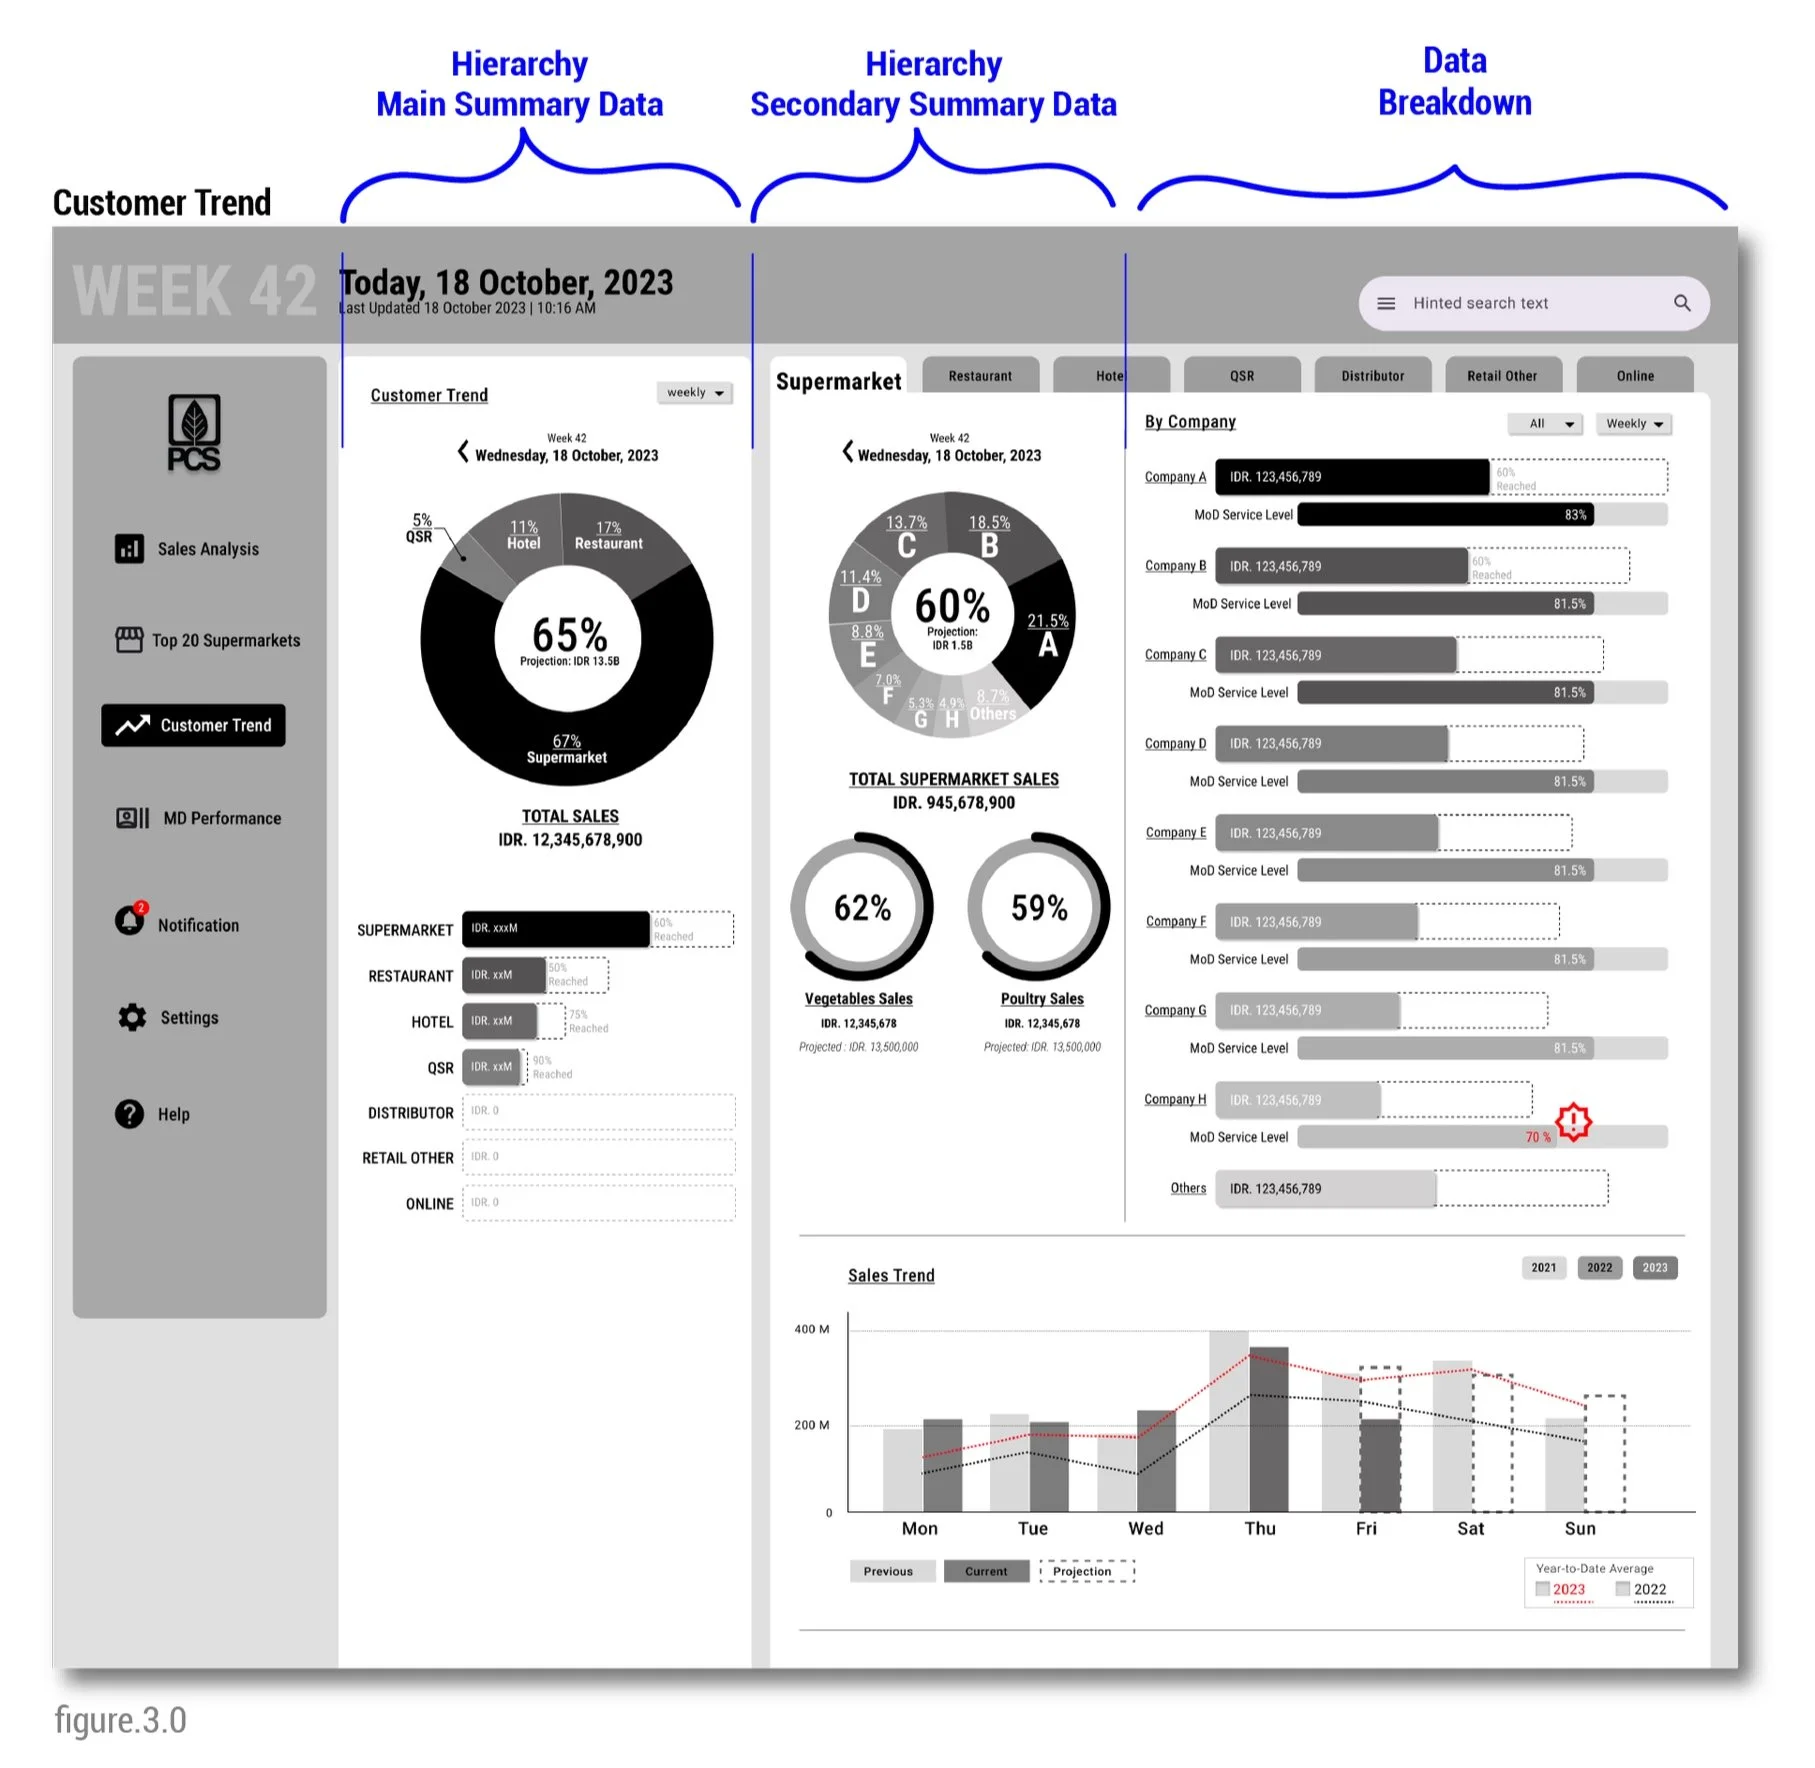
Customer Trend page (fig 3.0)
This page has the main three columns but within the third column it is subdivided again by hierarchy of data to further breakdown the specific customer’s data. An alert will also be implemented when a specific company is under performing so quick actions can be done to mitigate bigger issues.
Sally will also be able to quickly navigate to another customer group (restaurant, hotel, QSR, etc) by clicking on the tabs above.
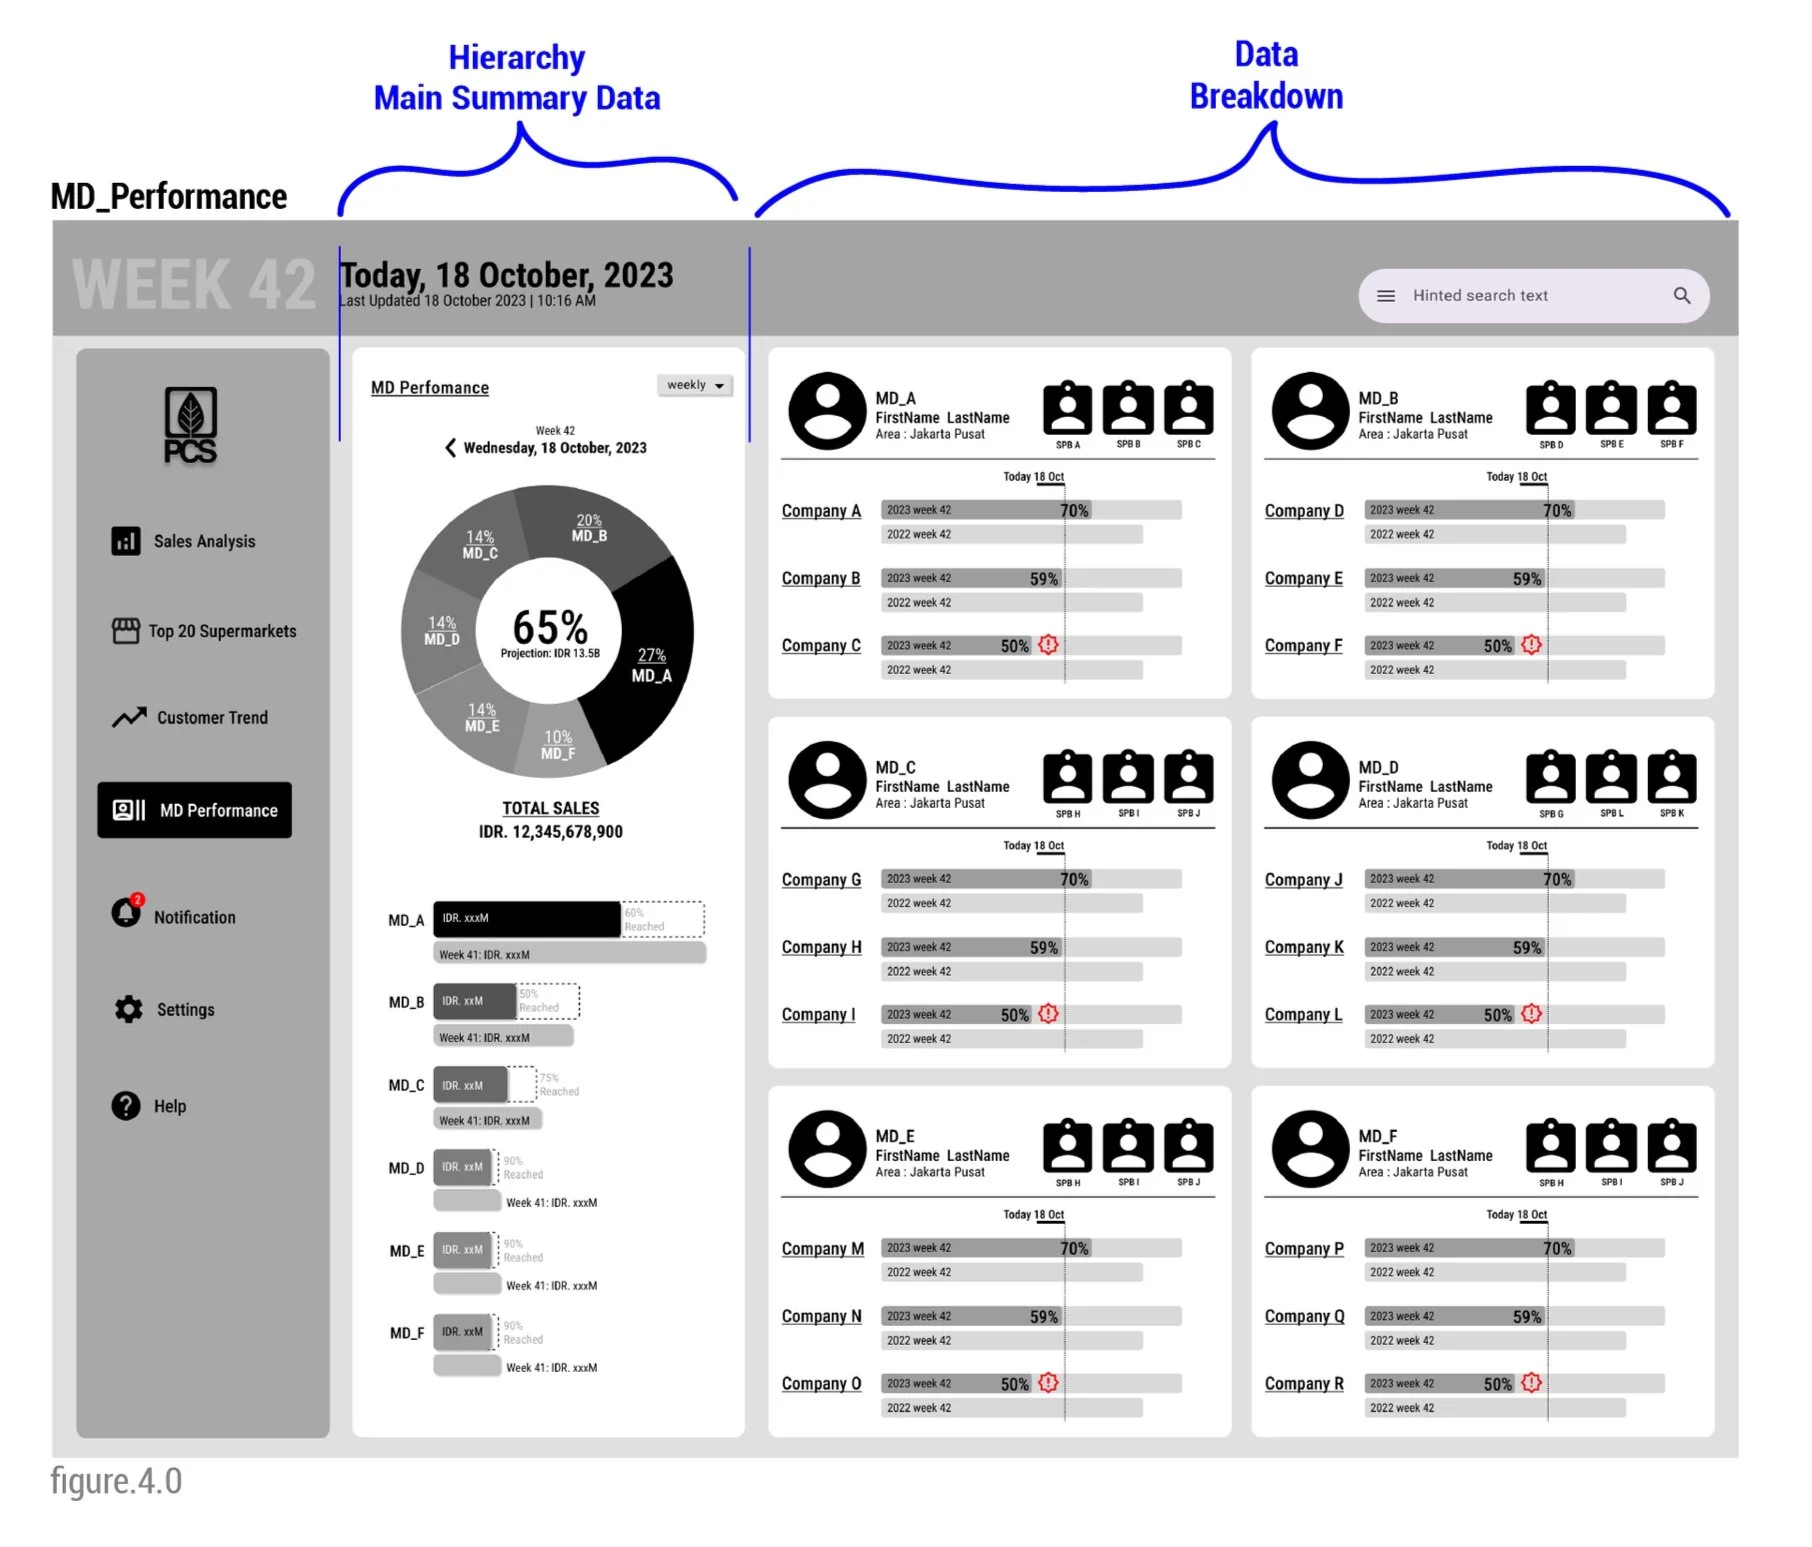
MD Performance page (fig 4.0)
Just like the previous three pages, this last page conforms to the 3-column layout. The last column is filled with information cards for Merchandisers (MD) that clearly list the companies and the Sales Promotional Boys/Girls (SPB/G) they are responsible for. Sally will also be able to see if any of the companies are performing below target or projection and from here , she can click on the specific company like company C to go directly to the company’s data summary to get more information.
Impact
As of 2025, the PCS executive dashboard has been in active daily use for over a year. It has gone through multiple mini-iterations based on real-time user feedback, resulting in a tool that now looks quite different from the original mid-fidelity mockups. Built entirely in Power BI, with its known design constraints, the dashboard has nonetheless become a trusted part of the leadership team’s daily workflow. “It’s been tremendously helpful,” said the CFO. The CEO, recognizing the dashboard’s role in driving more agile, data-informed decisions and exponential sales growth, commissioned a second dashboard for a sister company. While the live dashboard cannot be shown here due to privacy and platform limitations, its impact is clear: a shift in how leadership reads, trusts, and acts on data.